You're guessing what visitors do on your site. Stop.
Heatmap.report shows you the actual clicks, scrolls and journeys on every page of your hotel, venue or retreat website — delivered as a branded monthly PDF, not another dashboard to log into.
Your booking funnel is fine on desktop. On mobile, you have no idea.
Google Analytics tells you the number of sessions. It doesn't tell you that 64% of mobile visitors never scroll past the fold, or that the "Book Now" button on your "Things To Do" page is being missed because it sits below a clickable image people assume is the CTA.
Operators we work with are usually surprised by at least one finding in their first month. The next month, they have a list of fixes — and a way to measure whether the fixes worked.
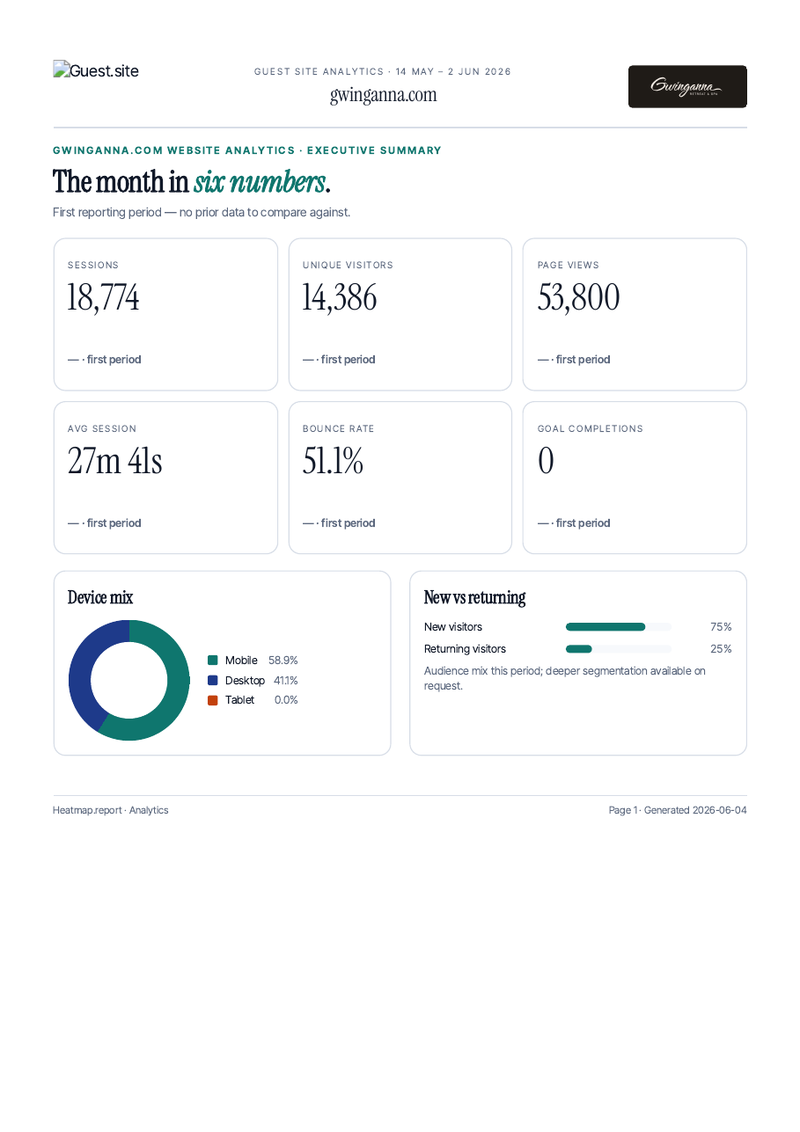
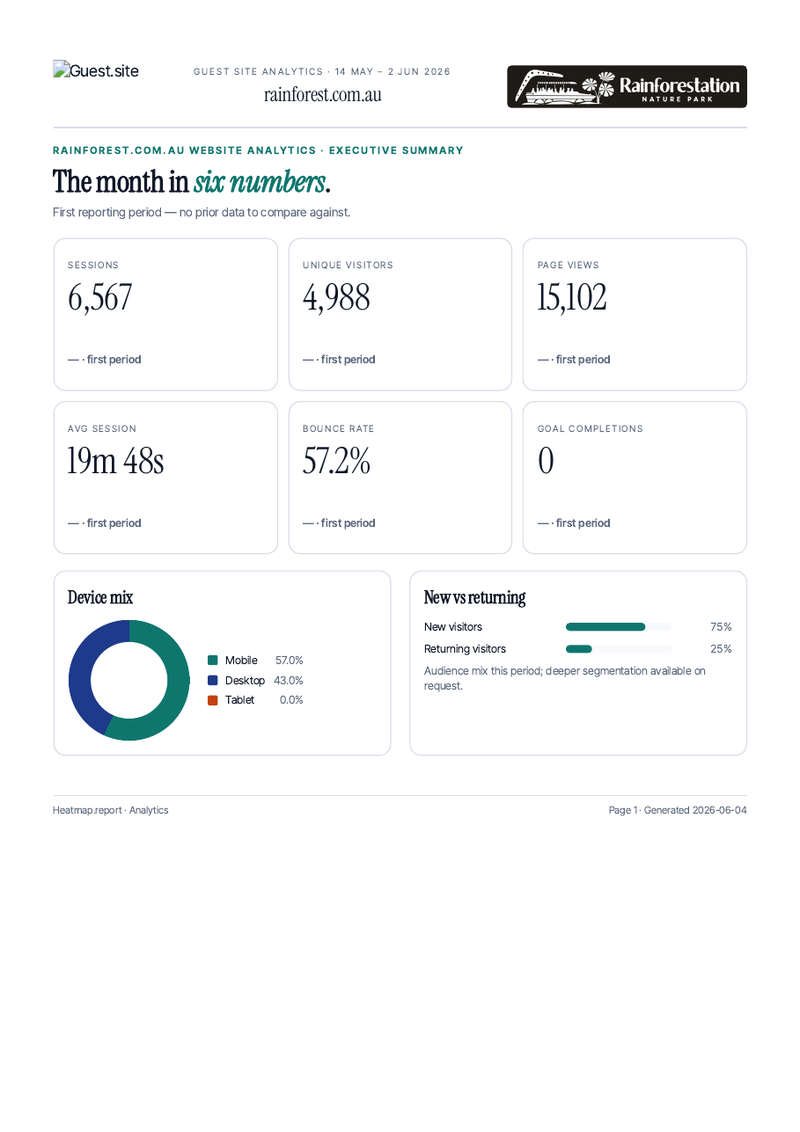
Five views of the same month.
Every report opens with the headline metrics, then walks through behaviour page by page. You can read the whole thing in 8 minutes; the page-by-page sections are where the decisions come from.
Click heatmaps
A pixel-density overlay on a screenshot of every page that matters to you. Shows where visitors actually tap, including the elements they think are clickable but aren't.
Scroll depth
How far down each page visitors actually go, with the drop-off thresholds called out. Almost every site we look at has at least one page where the conversion CTA is below the fold.
Session replay storyboard
Not just metrics — actual frame-by-frame storyboards of a handful of representative sessions, captioned by an analyst. You see the journey, not just the funnel.
DOM-element click ranking
Top-clicked elements on each page, ranked. Tells you which navigation items are pulling weight and which are taking up space.
Acquisition + geography
Where the traffic came from (direct, referral, campaign), and where in the world. Plus device split — mobile / desktop / tablet broken out so you can see which audience your design needs to serve.
Goals & conversions
Set goals once (a Book button, a contact form, a phone tap) and every monthly report shows completions and the funnel steps leading to them.
10 minutes to install. Monthly reports start arriving 4 weeks later.
No engineering project, no DevOps. We give you one line of HTML to paste into your existing chat widget; from then on, every month a fresh report PDF lands in your inbox.
One line to install
We give you a single <img> snippet for your chat widget's header. No new script tag on your site, no CMS access needed.
Tracker starts collecting
Click, scroll, replay, and goal data flow into your private analytics database from the moment the snippet is saved. No PII; respects DNT.
First report at 14 days
A "welcome report" lands at the 2-week mark so you see real numbers from your site, not a generic sample.
Monthly cadence
Every month after that, you get a fresh PDF for the previous calendar month. Branded to match your customer site, written by an analyst.
Polished, page-by-page PDFs.
These are actual cover pages from reports we've produced. Branded to match each customer's site; written like an analyst's note, not a dashboard dump.

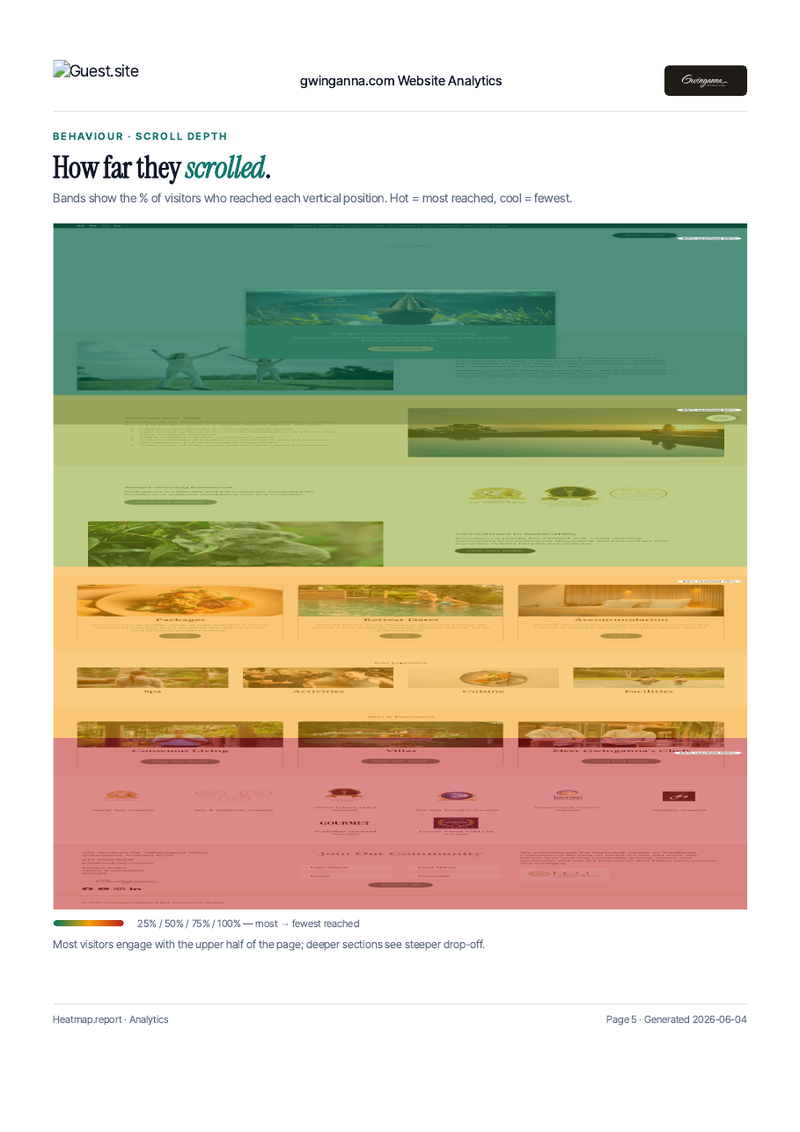
Inside the report: a heatmap on every page.
Each report includes a page-by-page heatmap section. A high-resolution screenshot of the page with a pixel-density overlay shows you the real click distribution from the month's visitors.
- Separate overlays for mobile and desktop sessions
- Hot zones called out with analyst captions
- Dead-zone callouts (where you'd expect clicks and aren't getting them)
- Branded to match your customer site's colours and logo
Active venues on the platform today.
Book a 15-minute demo
We'll walk through a live report against a real venue site. Fill this in and we'll come back to you with a time within 24 hours.
Got it — thanks!
Your request is on its way. We'll come back to you within 24 hours with a confirmed time.